Ethereum’s long-term chart is flashing a rare pattern that has held through some of the worst crypto downturns in history. Now, the clock is ticking toward a decisive moment.
What to Know
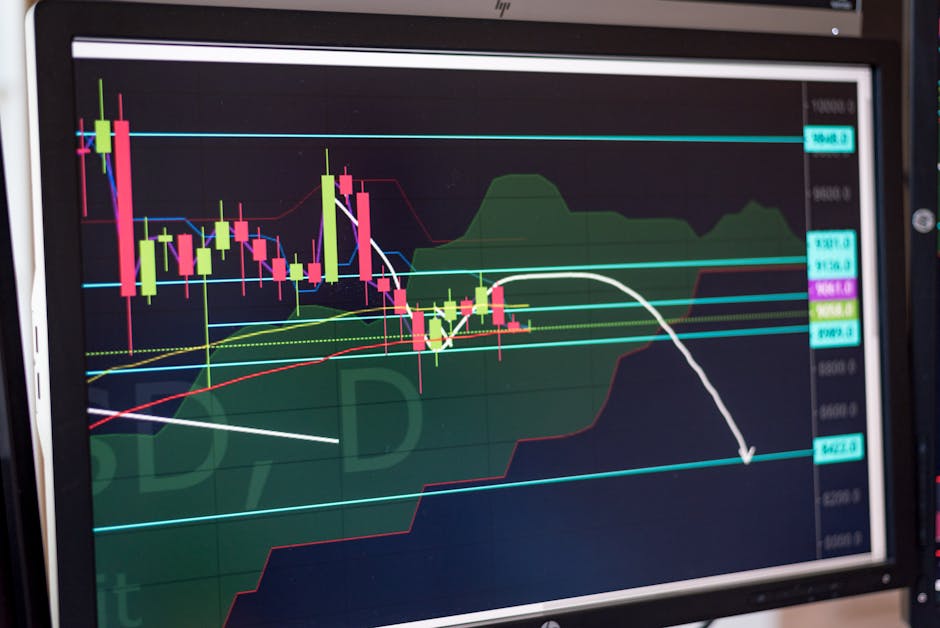
- Ethereum’s 3-week candlestick chart reveals a golden triangle formation, with a long ascending support line originating near the early market cycle lows.
- The pattern has survived the Covid crash, the 2022 bear market, and the ongoing 2026 correction that began after the August 2025 all-time high of $4,946.
- The upper boundary is a horizontal trendline in the $4,800 to $4,900 range, forming a resistance zone that has capped price repeatedly.
- The apex of this golden triangle is approaching, and the analyst who first identified the pattern says the outcome may define Ethereum’s trajectory for years.
- Meanwhile, the broader crypto market is under pressure: Bitcoin has been under bearish pressure for 48 days, Cardano hit five-year lows, XRP dropped below $1, and Dogecoin is testing a channel floor.
- Ethereum’s structure, in contrast, presents a textbook consolidation pattern that could resolve bullishly if the resistance breaks.
“The last time Ethereum did this against Bitcoin, it exploded above $4,000.” — Related commentary from the analysis.
The Pattern That Endured
Most technical patterns don’t survive multiple cycles. They get invalidated by a single flash crash or a sustained downtrend. But Ethereum’s golden triangle is different. It began forming near the early market cycle lows — before the 2020 pandemic sell-off, before the 2022 bear market, and before the most recent correction from the August 2025 all-time high of $4,946.
Each time the price fell, it found support on the same upward-sloping line. Each time it rallied, it was rejected by a flat resistance around $4,800–$4,900. The result is a symmetrical triangle that is now compressing price into an increasingly narrow range — the textbook prelude to a breakout.
What makes this formation remarkable is not its shape but its stamina. Very few chart patterns remain intact through a pandemic, a crypto winter, and a cycle top. The fact that Ethereum’s structure has held suggests that underlying demand is stepping in at progressively higher lows, even when macro sentiment turns sour.
A Closer Look at the Golden Triangle
A golden triangle (often called a symmetrical triangle or pennant on longer timeframes) is a continuation pattern that typically resolves in the direction of the prior trend. For Ethereum, the prior macro trend is up — from double-digit prices in the early years to a peak of $4,946 in August 2025.
On the 3-week chart, the picture is stark. The descending line forming the triangle’s upper boundary is nearly horizontal, indicating that sellers are willing to offload at consistent levels. The rising support line, however, is steep — signaling that buyers are becoming more aggressive over time. This asymmetry often precedes a breakout to the upside, though no outcome is guaranteed.
The analyst who first flagged this pattern emphasized that the apex — where the two trendlines converge — is the critical moment. At that point, price can no longer oscillate between support and resistance and must choose a direction. Given the pattern’s longevity, a breakout above $4,900 could trigger a significant rally, while a breakdown below support could lead to a deeper correction.
The Resistance Zone and All-Time High
The horizontal resistance at $4,800–$4,900 is more than just a line on a chart. It is the price area where Ethereum topped in August 2025, establishing the current all-time high of $4,946. Approaching this zone again, after a correction that dipped well below, creates a natural test of supply.
If Ethereum can reclaim and hold above $4,900, it would not only break the golden triangle’s upper boundary but also challenge the all-time high itself. That would represent a technical breakout of the highest order. Conversely, a failure at resistance could reinforce the horizontal ceiling, prolonging the consolidation or even breaking the support line.
The analyst referenced a related comparison: the last time Ethereum showed a similar structural advantage against Bitcoin, it went on to explode above $4,000. Historical parallels are never perfect, but they add weight to the bull case.
Ethereum in a Sea of Red
While Ethereum’s chart paints a resilient picture, the rest of the cryptocurrency market is far less optimistic. As of early June 2026:
- Bitcoin has been under sustained bearish pressure for 48 consecutive days, with price action reflecting a lack of bullish momentum.
- Cardano crashed to its lowest price in over five years, triggering widespread fear.
- XRP dropped below the $1 mark after a 22% retrace in 30 days.
- Dogecoin is testing the floor of a parallel channel, raising the risk of a breakdown.
In this environment, Ethereum’s relative strength stands out. While other large-cap coins are breaking down or languishing, Ethereum is holding a multi-year support line and pressing against a defined resistance. That divergence is worth noting: if the broader market stabilizes or recovers, Ethereum may be best-positioned to lead.
What the Apex Could Bring
The apex of the golden triangle is imminent — likely within the next few candlesticks on the 3-week chart. The analyst’s core thesis is that whatever happens at this juncture will define Ethereum’s trajectory for the next several years.
A bullish breakout above $4,900 could open the door to new all-time highs and beyond, validating the long-term uptrend. A bearish breakdown below the ascending support would suggest that the pattern is failing, potentially signaling a structural shift in sentiment and a move toward lower price levels.
Given the pattern’s duration, the move following the breakout is expected to be significant. In technical analysis, the length of time a triangle compresses is often proportional to the size of the ensuing breakout. A multi-year consolidation implies a multi-year move.
Looking Ahead
Ethereum sits at a technical crossroads. The golden triangle formation — battle-tested by a pandemic, a bear market, and a correction — is about to deliver its verdict. For investors and traders alike, the next few weeks are critical.
If the support line holds and Ethereum breaks through resistance, the message is clear: the bull market is not over. If the pattern breaks down, it may signal that even the strongest structures can crack under persistent macro pressure.
Either way, the chart is demanding attention. The apex is here. The answer is coming.