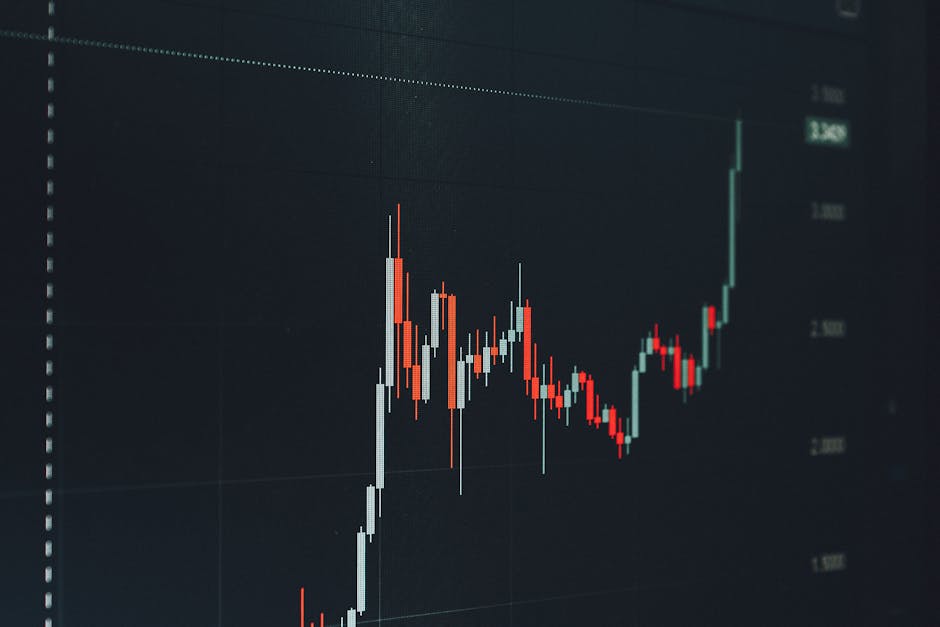
After weeks of consolidation between $1 and $1.50, XRP briefly surged past resistance on regulatory optimism, only to face a sharp rejection. The pullback now tests a key support zone, leaving traders questioning the next direction.
What to know
- XRP has been trading in a tight $1–$1.50 range for the past month, repeatedly attempting to break the upper boundary.
- Last Thursday, the altcoin rallied above this resistance on news of CLARITY Act progress, hitting a two-month high of $1.54.
- The breakout was short-lived: the price was quickly rejected and has since declined roughly 12% over five days.
- On Tuesday, XRP fell to $1.35 — its lowest level since late April — placing it at a crucial support area.
- Analysts, including ChartNerd, are focusing on key technical indicators that could determine whether the pullback is temporary or the start of a deeper correction.
The Breakout That Fizzled
For more than a month, XRP traders watched the price oscillate between well-established boundaries. The $1 mark acted as a floor, while $1.50 stood as a stubborn ceiling. Each attempt to push higher was met with selling pressure, reinforcing the range-bound narrative. Then, late last week, a catalyst emerged.
XRP surged to $1.54 last Thursday, its highest level in two months, breaking decisively above the $1.50 resistance.
The move was fueled by progress on the CLARITY Act, a piece of U.S. legislation that aims to provide clearer regulatory guidelines for digital assets. For a market hungry for regulatory direction, the news sparked a wave of buying that briefly lifted XRP out of its consolidation. But the euphoria did not last.
Within hours, sellers stepped in. The price was pushed back below $1.50, and the retreat accelerated in the following days. By Tuesday, XRP had given back all its gains and more, sliding to $1.35.
The CLARITY Act Catalyst
The CLARITY Act has been a recurring talking point in the crypto space, particularly among projects that have faced regulatory ambiguity. XRP, with its ongoing legal and regulatory history, stands to benefit from any legislative clarity that distinguishes between securities and commodities. The brief spike to $1.54 reflected optimism that such clarity might be on the horizon.
However, the market's reaction suggests that traders remain cautious. The rapid rejection indicates that the breakout lacked follow-through buying — a classic sign of a failed move. Resistance turned back into a ceiling, and the focus quickly shifted back to support.
The $1.50 level, once a barrier to upside, now represents a key overhead supply zone that bulls must reclaim to regain momentum.
Without sustained volume or additional positive developments, the initial excitement faded, leaving XRP vulnerable to a retest of the lower end of its range.
Technicals Under the Microscope
The price action over the past week has put technical analysis in the spotlight. With XRP returning to a well-known demand zone near $1.35, traders are scrutinizing chart patterns and momentum indicators.
ChartNerd, a pseudonymous analyst closely followed in the XRP community, has highlighted specific technical tools that could signal the next move. While the exact indicators are not specified in public reports, the broader implication is clear: the market is at a decision point.
- If $1.35 holds as support, the consolidation could continue, potentially setting up another test of the upper resistance.
- A breakdown below $1.35 would likely open the door to $1.00 and below, marking a more severe correction.
Some analysts argue that the recent pullback may be a healthy retest of support, while others warn it could be the beginning of a deeper downtrend.
Volume patterns, relative strength, and moving averages are likely being watched to confirm the next trend. The next few trading sessions are critical.
The $1.35 Support Test
The current price level at $1.35 is not arbitrary. It represents the lowest point XRP has traded since late April and aligns with prior support from earlier in the consolidation cycle. In technical terms, this is a make-or-break zone.
If buyers step in here, it would reinforce the range-bound structure. A bounce from $1.35 could set the stage for a re-test of $1.50 and possibly a more sustainable breakout. However, if sellers continue to dominate, a break below $1.35 would signal that the bears have taken control.
XRP has tested this area multiple times in recent weeks, and each time it has found buying interest. The question is whether that pattern will hold.
What Analysts Like ChartNerd Are Watching
ChartNerd and other technical analysts are likely focusing on momentum oscillators (like RSI), volume divergence, and the behavior of moving averages. A bearish cross or weakening momentum could argue for a correction continuation. Conversely, a bullish divergence or oversold reading could hint at a reversal.
Without exact quotes or specific numbers from the Trend data, the key takeaway is that the analyst community is divided. Some view the pullback as a buying opportunity within a longer consolidation; others see warning signs of a trend reversal.
The lack of a decisive breakout above $1.50, followed by a 12% decline, has introduced significant uncertainty into the short-term outlook.
Looking Ahead
The path forward for XRP hinges on two main factors: legislative developments (the CLARITY Act and broader regulatory news) and technical support at $1.35. If the latter holds and volume picks up, a re-test of resistance is likely. If it fails, the next floor could be the psychological $1.00 mark.
Traders should monitor the price action closely, particularly any signs of a bullish reversal pattern at the current support level. Meanwhile, news surrounding the CLARITY Act will remain a wildcard, capable of triggering another rapid move if progress updates emerge.
For now, XRP remains in a no-man's-land — trapped between old resistance and a crucial support. The next move will tell the story.